DSP Focused Fund - Regular Plan - Growth
(Erstwhile DSP BlackRock Focus 25 Fund - Regular Plan - Growth)
| Category: Equity: Focused |
| Launch Date: 10-06-2010 |
| Asset Class: Equity |
| Benchmark: NIFTY 500 TRI |
| Expense Ratio: 2.01% As on (31-12-2025) |
| Status: Open Ended Schemes |
| Minimum Investment: 100.0 |
| Minimum Topup: 100.0 |
| Total Assets: 2,686.67 Cr As on (31-12-2025) |
| Turn over: 43% |
55.592
1.52 (2.7288%)
11.57%
NIFTY 500 TRI 12.26%
PERFORMANCE of DSP Focused Fund - Regular Plan - Growth
Scheme Performance (%)
Data as on - 03-02-2026Yearly Performance (%)
Fund Managers
Mr. Vinit Sambre, Mr. Bhavin Gandhi
Investment Objective
The primary investment objective of the Scheme is to generate longterm capital growth from a portfolio of equity and equity-related securities including equity derivatives. The portfolio will consist of multi cap companies by market capitalisation. The Scheme will hold equity and equity-related securities including equity derivatives, of upto 30 companies. The Scheme may also invest in debt and money market securities, for defensive considerations and/or for managing liquidity requirements. There is no assurance that the investment objective of the Scheme will be achieved.
NAV & Lumpsum details( Invested amount 1,00,000)
| NAV Date | NAV | Units | Market Value |
Returns (%) |
|---|---|---|---|---|
| 10-06-2010 | 10.0 | 10000.0 | 100000 | 0.0 % |
| 12-07-2010 | 10.403 | - | 104030 | 4.03 % |
| 10-08-2010 | 10.586 | - | 105860 | 5.86 % |
| 13-09-2010 | 11.163 | - | 111630 | 11.63 % |
| 11-10-2010 | 11.558 | - | 115580 | 15.58 % |
| 10-11-2010 | 11.785 | - | 117850 | 17.85 % |
| 10-12-2010 | 10.732 | - | 107320 | 7.32 % |
| 10-01-2011 | 10.574 | - | 105740 | 5.74 % |
| 10-02-2011 | 9.659 | - | 96590 | -3.41 % |
| 10-03-2011 | 10.045 | - | 100450 | 0.45 % |
| 11-04-2011 | 10.573 | - | 105730 | 5.73 % |
| 10-05-2011 | 10.403 | - | 104030 | 4.03 % |
| 10-06-2011 | 10.318 | - | 103180 | 3.18 % |
| 11-07-2011 | 10.898 | - | 108980 | 8.98 % |
| 10-08-2011 | 10.22 | - | 102200 | 2.2 % |
| 12-09-2011 | 9.869 | - | 98690 | -1.31 % |
| 10-10-2011 | 9.615 | - | 96150 | -3.85 % |
| 11-11-2011 | 9.842 | - | 98420 | -1.58 % |
| 12-12-2011 | 8.996 | - | 89960 | -10.04 % |
| 10-01-2012 | 8.981 | - | 89810 | -10.19 % |
| 10-02-2012 | 10.1 | - | 101000 | 1.0 % |
| 12-03-2012 | 9.806 | - | 98060 | -1.94 % |
| 10-04-2012 | 9.677 | - | 96770 | -3.23 % |
| 10-05-2012 | 8.951 | - | 89510 | -10.49 % |
| 11-06-2012 | 8.879 | - | 88790 | -11.21 % |
| 10-07-2012 | 9.33 | - | 93300 | -6.7 % |
| 10-08-2012 | 9.292 | - | 92920 | -7.08 % |
| 10-09-2012 | 9.481 | - | 94810 | -5.19 % |
| 10-10-2012 | 10.02 | - | 100200 | 0.2 % |
| 12-11-2012 | 10.361 | - | 103610 | 3.61 % |
| 10-12-2012 | 10.823 | - | 108230 | 8.23 % |
| 10-01-2013 | 11.384 | - | 113840 | 13.84 % |
| 11-02-2013 | 10.951 | - | 109510 | 9.51 % |
| 11-03-2013 | 10.53 | - | 105300 | 5.3 % |
| 10-04-2013 | 9.999 | - | 99990 | -0.01 % |
| 10-05-2013 | 10.486 | - | 104860 | 4.86 % |
| 10-06-2013 | 10.058 | - | 100580 | 0.58 % |
| 10-07-2013 | 10.006 | - | 100060 | 0.06 % |
| 12-08-2013 | 9.472 | - | 94720 | -5.28 % |
| 10-09-2013 | 9.732 | - | 97320 | -2.68 % |
| 10-10-2013 | 10.215 | - | 102150 | 2.15 % |
| 11-11-2013 | 10.42 | - | 104200 | 4.2 % |
| 10-12-2013 | 10.903 | - | 109030 | 9.03 % |
| 10-01-2014 | 10.799 | - | 107990 | 7.99 % |
| 10-02-2014 | 10.442 | - | 104420 | 4.42 % |
| 10-03-2014 | 11.12 | - | 111200 | 11.2 % |
| 10-04-2014 | 11.499 | - | 114990 | 14.99 % |
| 12-05-2014 | 12.115 | - | 121150 | 21.15 % |
| 10-06-2014 | 13.667 | - | 136670 | 36.67 % |
| 10-07-2014 | 13.67 | - | 136700 | 36.7 % |
| 11-08-2014 | 13.719 | - | 137190 | 37.19 % |
| 10-09-2014 | 15.14 | - | 151400 | 51.4 % |
| 10-10-2014 | 14.799 | - | 147990 | 47.99 % |
| 10-11-2014 | 16.057 | - | 160570 | 60.57 % |
| 10-12-2014 | 16.41 | - | 164100 | 64.1 % |
| 12-01-2015 | 16.786 | - | 167860 | 67.86 % |
| 10-02-2015 | 17.097 | - | 170970 | 70.97 % |
| 10-03-2015 | 17.893 | - | 178930 | 78.93 % |
| 10-04-2015 | 18.129 | - | 181290 | 81.29 % |
| 11-05-2015 | 17.015 | - | 170150 | 70.15 % |
| 10-06-2015 | 17.167 | - | 171670 | 71.67 % |
| 10-07-2015 | 17.829 | - | 178290 | 78.29 % |
| 10-08-2015 | 18.555 | - | 185550 | 85.55 % |
| 10-09-2015 | 16.915 | - | 169150 | 69.15 % |
| 12-10-2015 | 17.355 | - | 173550 | 73.55 % |
| 10-11-2015 | 17.01 | - | 170100 | 70.1 % |
| 10-12-2015 | 16.672 | - | 166720 | 66.72 % |
| 11-01-2016 | 16.334 | - | 163340 | 63.34 % |
| 10-02-2016 | 15.247 | - | 152470 | 52.47 % |
| 10-03-2016 | 15.717 | - | 157170 | 57.17 % |
| 11-04-2016 | 16.473 | - | 164730 | 64.73 % |
| 10-05-2016 | 16.973 | - | 169730 | 69.73 % |
| 10-06-2016 | 17.334 | - | 173340 | 73.34 % |
| 11-07-2016 | 18.155 | - | 181550 | 81.55 % |
| 10-08-2016 | 18.751 | - | 187510 | 87.51 % |
| 12-09-2016 | 19.524 | - | 195240 | 95.24 % |
| 10-10-2016 | 19.854 | - | 198540 | 98.54 % |
| 10-11-2016 | 19.308 | - | 193080 | 93.08 % |
| 12-12-2016 | 18.091 | - | 180910 | 80.91 % |
| 10-01-2017 | 18.36 | - | 183600 | 83.6 % |
| 10-02-2017 | 19.743 | - | 197430 | 97.43 % |
| 10-03-2017 | 19.419 | - | 194190 | 94.19 % |
| 10-04-2017 | 20.515 | - | 205150 | 105.15 % |
| 10-05-2017 | 20.966 | - | 209660 | 109.66 % |
| 12-06-2017 | 21.095 | - | 210950 | 110.95 % |
| 10-07-2017 | 21.261 | - | 212610 | 112.61 % |
| 10-08-2017 | 21.508 | - | 215080 | 115.08 % |
| 11-09-2017 | 22.365 | - | 223650 | 123.65 % |
| 10-10-2017 | 22.266 | - | 222660 | 122.66 % |
| 10-11-2017 | 22.289 | - | 222890 | 122.89 % |
| 11-12-2017 | 22.494 | - | 224940 | 124.94 % |
| 10-01-2018 | 23.366 | - | 233660 | 133.66 % |
| 12-02-2018 | 22.819 | - | 228190 | 128.19 % |
| 12-03-2018 | 22.199 | - | 221990 | 121.99 % |
| 10-04-2018 | 22.661 | - | 226610 | 126.61 % |
| 10-05-2018 | 22.655 | - | 226550 | 126.55 % |
| 11-06-2018 | 22.609 | - | 226090 | 126.09 % |
| 10-07-2018 | 22.782 | - | 227820 | 127.82 % |
| 10-08-2018 | 23.752 | - | 237520 | 137.52 % |
| 10-09-2018 | 23.329 | - | 233290 | 133.29 % |
| 10-10-2018 | 20.752 | - | 207520 | 107.52 % |
| 12-11-2018 | 20.941 | - | 209410 | 109.41 % |
| 10-12-2018 | 21.061 | - | 210610 | 110.61 % |
| 10-01-2019 | 21.638 | - | 216380 | 116.38 % |
| 11-02-2019 | 21.165 | - | 211650 | 111.65 % |
| 11-03-2019 | 22.308 | - | 223080 | 123.08 % |
| 10-04-2019 | 22.874 | - | 228740 | 128.74 % |
| 10-05-2019 | 22.268 | - | 222680 | 122.68 % |
| 10-06-2019 | 23.775 | - | 237750 | 137.75 % |
| 10-07-2019 | 23.082 | - | 230820 | 130.82 % |
| 13-08-2019 | 21.788 | - | 217880 | 117.88 % |
| 11-09-2019 | 22.253 | - | 222530 | 122.53 % |
| 10-10-2019 | 23.257 | - | 232570 | 132.57 % |
| 11-11-2019 | 25.178 | - | 251780 | 151.78 % |
| 10-12-2019 | 25.06 | - | 250600 | 150.6 % |
| 10-01-2020 | 26.002 | - | 260020 | 160.02 % |
| 10-02-2020 | 25.896 | - | 258960 | 158.96 % |
| 11-03-2020 | 22.466 | - | 224660 | 124.66 % |
| 13-04-2020 | 18.463 | - | 184630 | 84.63 % |
| 11-05-2020 | 18.925 | - | 189250 | 89.25 % |
| 10-06-2020 | 20.666 | - | 206660 | 106.66 % |
| 10-07-2020 | 22.081 | - | 220810 | 120.81 % |
| 10-08-2020 | 23.197 | - | 231970 | 131.97 % |
| 10-09-2020 | 23.055 | - | 230550 | 130.55 % |
| 12-10-2020 | 24.049 | - | 240490 | 140.49 % |
| 10-11-2020 | 25.12 | - | 251200 | 151.2 % |
| 10-12-2020 | 26.905 | - | 269050 | 169.05 % |
| 11-01-2021 | 29.462 | - | 294620 | 194.62 % |
| 10-02-2021 | 30.261 | - | 302610 | 202.61 % |
| 10-03-2021 | 29.913 | - | 299130 | 199.13 % |
| 12-04-2021 | 28.984 | - | 289840 | 189.84 % |
| 10-05-2021 | 29.866 | - | 298660 | 198.66 % |
| 10-06-2021 | 31.827 | - | 318270 | 218.27 % |
| 12-07-2021 | 32.8 | - | 328000 | 228.0 % |
| 10-08-2021 | 33.745 | - | 337450 | 237.45 % |
| 13-09-2021 | 35.07 | - | 350700 | 250.7 % |
| 11-10-2021 | 34.635 | - | 346350 | 246.35 % |
| 10-11-2021 | 35.627 | - | 356270 | 256.27 % |
| 10-12-2021 | 34.311 | - | 343110 | 243.11 % |
| 10-01-2022 | 35.071 | - | 350710 | 250.71 % |
| 10-02-2022 | 34.064 | - | 340640 | 240.64 % |
| 10-03-2022 | 31.356 | - | 313560 | 213.56 % |
| 11-04-2022 | 33.345 | - | 333450 | 233.45 % |
| 10-05-2022 | 30.512 | - | 305120 | 205.12 % |
| 10-06-2022 | 30.037 | - | 300370 | 200.37 % |
| 11-07-2022 | 30.729 | - | 307290 | 207.29 % |
| 10-08-2022 | 33.231 | - | 332310 | 232.31 % |
| 12-09-2022 | 34.823 | - | 348230 | 248.23 % |
| 10-10-2022 | 33.478 | - | 334780 | 234.78 % |
| 10-11-2022 | 34.004 | - | 340040 | 240.04 % |
| 12-12-2022 | 33.844 | - | 338440 | 238.44 % |
| 10-01-2023 | 32.444 | - | 324440 | 224.44 % |
| 10-02-2023 | 32.978 | - | 329780 | 229.78 % |
| 10-03-2023 | 32.096 | - | 320960 | 220.96 % |
| 10-04-2023 | 31.95 | - | 319500 | 219.5 % |
| 10-05-2023 | 33.525 | - | 335250 | 235.25 % |
| 12-06-2023 | 35.144 | - | 351440 | 251.44 % |
| 10-07-2023 | 36.242 | - | 362420 | 262.42 % |
| 10-08-2023 | 37.975 | - | 379750 | 279.75 % |
| 11-09-2023 | 39.694 | - | 396940 | 296.94 % |
| 10-10-2023 | 39.079 | - | 390790 | 290.79 % |
| 10-11-2023 | 39.35 | - | 393500 | 293.5 % |
| 11-12-2023 | 43.029 | - | 430290 | 330.29 % |
| 10-01-2024 | 44.247 | - | 442470 | 342.47 % |
| 12-02-2024 | 43.848 | - | 438480 | 338.48 % |
| 11-03-2024 | 44.256 | - | 442560 | 342.56 % |
| 10-04-2024 | 45.458 | - | 454580 | 354.58 % |
| 10-05-2024 | 45.964 | - | 459640 | 359.64 % |
| 10-06-2024 | 49.129 | - | 491290 | 391.29 % |
| 10-07-2024 | 52.398 | - | 523980 | 423.98 % |
| 12-08-2024 | 52.6 | - | 526000 | 426.0 % |
| 10-09-2024 | 55.327 | - | 553270 | 453.27 % |
| 10-10-2024 | 55.339 | - | 553390 | 453.39 % |
| 11-11-2024 | 53.112 | - | 531120 | 431.12 % |
| 10-12-2024 | 54.551 | - | 545510 | 445.51 % |
| 10-01-2025 | 51.395 | - | 513950 | 413.95 % |
| 10-02-2025 | 50.537 | - | 505370 | 405.37 % |
| 10-03-2025 | 48.7 | - | 487000 | 387.0 % |
| 11-04-2025 | 49.788 | - | 497880 | 397.88 % |
| 12-05-2025 | 53.094 | - | 530940 | 430.94 % |
| 10-06-2025 | 54.884 | - | 548840 | 448.84 % |
| 10-07-2025 | 55.027 | - | 550270 | 450.27 % |
| 11-08-2025 | 52.469 | - | 524690 | 424.69 % |
| 10-09-2025 | 54.111 | - | 541110 | 441.11 % |
| 10-10-2025 | 54.594 | - | 545940 | 445.94 % |
| 10-11-2025 | 55.183 | - | 551830 | 451.83 % |
| 10-12-2025 | 55.777 | - | 557770 | 457.77 % |
| 12-01-2026 | 55.652 | - | 556520 | 456.52 % |
| 03-02-2026 | 55.592 | - | 555920 | 455.92 % |
RETURNS CALCULATOR for DSP Focused Fund - Regular Plan - Growth
Growth of 10000 In SIP (Fund vs Benchmark)
Growth of 10000 In LUMPSUM (Fund vs Benchmark)
Rolling Returns
Rolling returns are the annualized returns of the scheme taken for a specified period (rolling returns period) on every day/week/month and taken till the last day of the duration. In this chart we are showing the annualized returns over the rolling returns period on every day from the start date and comparing it with the benchmark. Rolling returns is the best measure of a fund's performance. Trailing returns have a recency bias and point to point returns are specific to the period in consideration. Rolling returns, on the other hand, measures the fund's absolute and relative performance across all timescales, without bias.
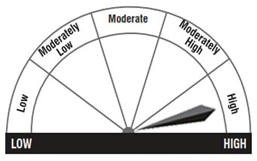
Riskometer
Key Performance and Risk Statistics of DSP Focused Fund - Regular Plan - Growth
| Key Statistics | Volatility | Sharpe Ratio | Alpha | Beta | Yield to Maturity | Average Maturity |
|---|---|---|---|---|---|---|
| DSP Focused Fund - Regular Plan - Growth | 14.04 | 1.0 | 3.11 | 0.92 | - | - |
| Equity: Focused | - | - | - | - | - | - |
PEER COMPARISION of DSP Focused Fund - Regular Plan - Growth
| Scheme Name | Launch Date |
1-Year Ret (%) |
2-Yrs Ret (%) |
3-Yrs Ret (%) |
5-Yrs Ret (%) |
10-Yrs Ret (%) |
|---|---|---|---|---|---|---|
| DSP Focused Fund - Regular Plan - Growth | 10-06-2010 | 9.9 | 11.96 | 19.39 | 13.29 | 13.61 |
| ICICI Prudential Focused Equity Fund - Growth | 05-05-2009 | 18.02 | 17.65 | 23.05 | 19.82 | 17.13 |
| Kotak Focused Fund- Regular plan - Growth Option | 05-07-2019 | 17.9 | 14.0 | 17.84 | 15.34 | 0.0 |
| ITI Focused Fund - Regular Plan - Growth | 19-06-2023 | 14.85 | 12.12 | 0.0 | 0.0 | 0.0 |
| Old Bridge Focused Fund - Regular Growth | 24-01-2024 | 14.34 | 11.64 | 0.0 | 0.0 | 0.0 |
| Aditya Birla Sun Life Focused Fund -Growth Option | 05-10-2005 | 12.83 | 12.8 | 17.61 | 14.07 | 14.3 |
| HDFC Focused Fund - GROWTH PLAN | 05-09-2004 | 12.81 | 15.5 | 21.64 | 22.11 | 16.09 |
| SBI FOCUSED FUND - REGULAR PLAN -GROWTH | 01-10-2004 | 11.83 | 14.85 | 18.53 | 15.5 | 15.38 |
| Nippon India Focused Fund -Growth Plan -Growth Option | 26-12-2006 | 10.89 | 8.52 | 14.94 | 14.62 | 14.79 |
| HSBC Focused Fund - Regular Growth | 22-07-2020 | 9.5 | 9.67 | 17.24 | 13.9 | 0.0 |
PORTFOLIO ANALYSIS of DSP Focused Fund - Regular Plan - Growth
Asset Allocation (%)
| Allocation | Percentage (%) |
|---|
Market Cap Distribution
Small Cap
18.29%
Others
6.0%
Others
0.74%
Large Cap
60.56%
Mid Cap
14.41%
Total
100%